Note
Go to the end to download the full example code.
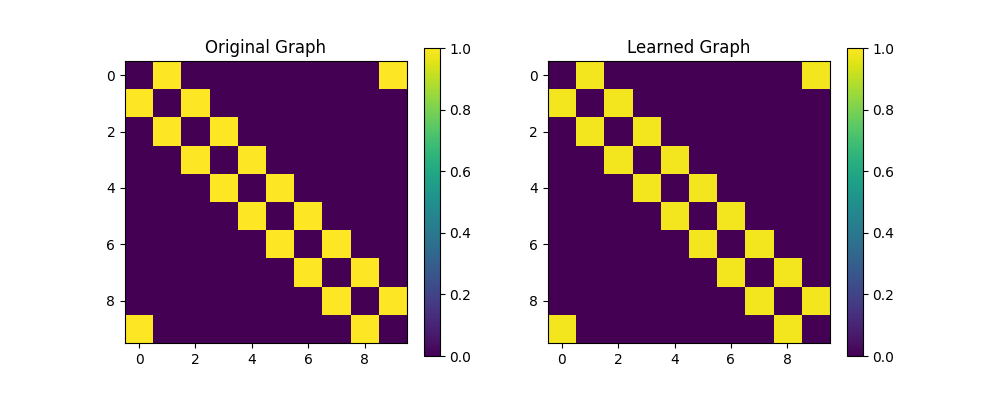
Graph learning.
Use Kalofolias2016 algorithm to learn the graph from a signal. The algorithm uses the pairwise distances between each node signal. In this case, we compute the euclidean distance between the node’s coordenates but the euclidean distance between each node signal would work in the same style.
import matplotlib.pyplot as plt
import numpy as np
from scipy import spatial

from pygsp2 import graph_learning, graphs
G = graphs.ring.Ring(10)

# We will learn the graph from the coords
# but signals from the graph also work the same
signal = G.coords
kdt = spatial.KDTree(signal)

D, NN = kdt.query(signal[:, None], k=len(signal))

# Allocate distance array
Z = np.zeros((G.N, G.N))
for i, n in enumerate(NN):
    Z[i, n] = D[i]

# Learn graph
A = 0.8
B = 0.1

W = graph_learning.graph_log_degree(Z, A, B)
W[W < 1e-5] = 0

plt.figure(figsize=(10, 4))
plt.subplot(121)
plt.imshow(G.W.toarray(), vmin=0, vmax=1)
plt.colorbar()
plt.title('Original Graph')

plt.subplot(122)
plt.imshow(W, vmin=0, vmax=1)
plt.colorbar()
plt.title('Learned Graph')

plt.show()
Found solution after 178 iterations
Total running time of the script: (0 minutes 0.304 seconds)
Estimated memory usage: 178 MB