Note
Go to the end to download the full example code.
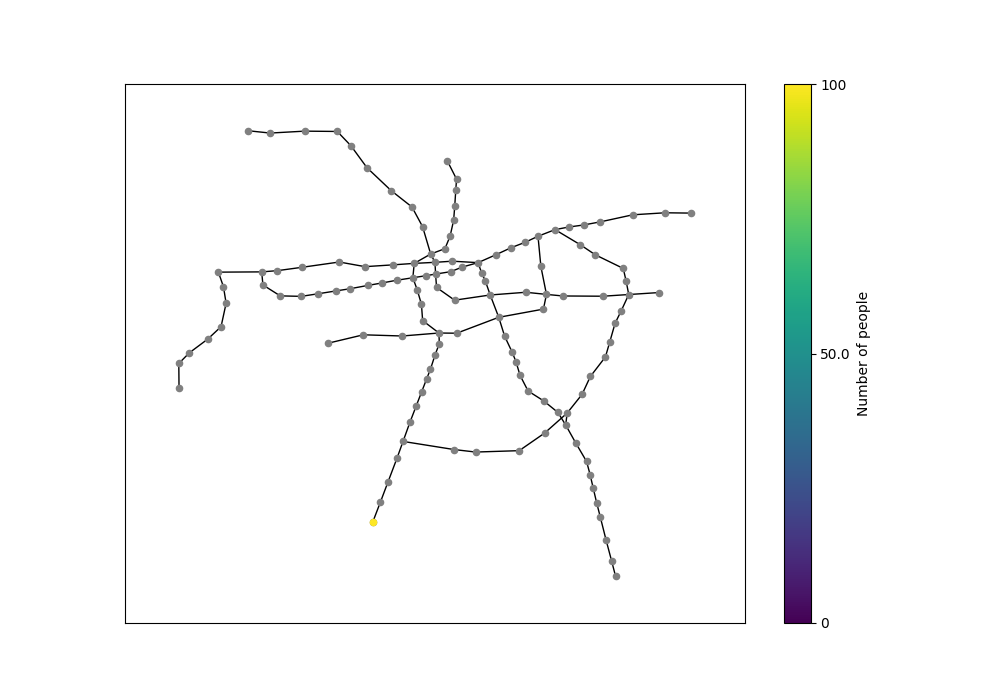
Metro simulation 2.
Example of a simulation of the evolution of a graph signal over the Santiago Metro network.
Simulation of the distribution of a signal over the metro network. The starting conditions is a graph signal with only one positive integer value bigger.The plots or animation show how this signal distributes over the network using:
This example adds some constraints to the previous metro simulation example. Some of them are:
- Eliminates the backward connections on the simulation and substracts 1 to
every node degree to avoid dilution of the signal by going backwards.
- If the 2 wagons arrive at the same metro station, there is no other way but
out. All the people in those wagons will exit the sations.
- In terminal stations, the people will not travel backwards this will also
force an exit to everyone that reaches the terminal station.
- If there are less than the number of people that is set to get out in every
station then then wagon is emptyed.
The output is a folder with numerated figures. You can use websites such as https://gifmaker.me/ to make an animation with the resulting figures.
The initial condition is a graph signal with only one positive integer value bigger.The plots or animation show how this signal distributes over the network using:
To run this example, you need to download three files and place them in the same directory as this script.
Download the file Tablas de subidas y bajadas nov23.zip from this link:
https://www.dtpm.cl/descargas/modelos_y_matrices/Tablas%20de%20subidas%20y%20bajadas%20nov23.zip
Then, uncompress the zip file and copy 2023.11 Matriz_baj_SS_MH.xlsb to the same location as this script.
Download the file santiago_metro_stations_coords.geojson from this link:
https://zenodo.org/records/11637462/files/santiago_metro_stations_coords.geojson
Download the file santiago_metro_stations_connections.txt from this link:
https://zenodo.org/records/11637462/files/santiago_metro_stations_connections.txt
import os

import matplotlib.pyplot as plt
import networkx as nx
import numpy as np

from pygsp2.utils_examples import fetch_data, make_metro_graph

current_dir = os.getcwd()
os.chdir(current_dir)

try:
    os.mkdir('metro_simulation2/')
except FileExistsError:
    print('Warning: It seems like this folder already exists. Overwritting...')
assets_dir = os.path.join(current_dir, 'data')
fetch_data(assets_dir, 'metro')
G, pos = make_metro_graph(edgesfile=os.path.join(assets_dir, 'santiago_metro_stations_connections.txt'),
                          coordsfile=os.path.join(assets_dir, 'santiago_metro_stations_coords.geojson'))
stations = list(G)

W0 = nx.adjacency_matrix(G).toarray()
D = np.diag(W0 @ np.ones(len(W0)))
# The signal will advance through the graph. In our case
# the backwards direction needs to be subtracted. Otherwise
# the signal will be "diluted" in each step by half since
# there is a backwards connection available.
D[D > 1] = D[D > 1] - 1
D_inv = np.linalg.inv(D)

# Store terminal stations. Anything that arrives here
# will get out of the network.
terminal_stations = np.where(np.sum(W0, axis=1) == 1)
NSTEPS = 27  # Arbitrary units, steps
INIT_VALUE = 5000  # Initial conditions
INIT_STATION = 103  # HOSPITAL DEL PINO
# Set constant value that will exit
# the network in each step
OUT_CONSTANT = 10

signal = np.zeros(len(W0))
signal[INIT_STATION] = INIT_VALUE
normalized_signal = signal / INIT_VALUE
nodelist = [list(G)[INIT_STATION]]

fig, ax = plt.subplots(figsize=(10, 7))
cmap = plt.get_cmap('viridis')
colors = cmap(normalized_signal[signal > 0])

nx.draw_networkx_edges(G, pos, node_size=20, ax=ax)
im = nx.draw_networkx_nodes(G, pos, node_color='gray', node_size=20, ax=ax)
im = nx.draw_networkx_nodes(G, pos, node_color=colors, nodelist=nodelist, node_size=20, ax=ax)
cbar = plt.colorbar(im, ax=ax, label='Number of people', ticks=[0, 0.5, 1])
cbar.set_ticklabels([0, (OUT_CONSTANT * 10) / 2, (OUT_CONSTANT * 10)])
plt.savefig('metro_simulation2/0.png')
visited_stations = [INIT_STATION]
mask = np.ones_like(W0)
W = W0 * mask

# People that leave the
# metro network in each station
left = np.zeros_like(signal)

for it in np.arange(1, NSTEPS):

    # Compute signal in new step
    signal = (W @ D_inv @ signal).astype(int)

    # Eliminate connections of visited stations
    mask[visited_stations, :] = 0
    mask[:, visited_stations] = 0

    W = W0 * mask

    # Check if people reached a terminal station
    stations2empty = np.intersect1d(np.where(signal)[0], terminal_stations)
    # Check if people reached a station that has no connections
    stations2empty2 = np.intersect1d(np.where(signal > 0)[0], np.where(W.sum(1) == 0)[0])

    if stations2empty.size > 0:
        print(f'It {it}: Emptying terminal stations')
        for i in stations2empty:
            print(f'\t{signal[i]} unboarded {stations[i]}')
            left[i] += signal[i]
            signal[i] -= signal[i]
    elif stations2empty2.size > 0:
        print(f'It {it}: Emptying encountered stations')
        for i in stations2empty2:
            print(f'\t{signal[i]} unboarded {stations[i]}')
            left[i] += signal[i]
            signal[i] -= signal[i]

    # Check if there is enough people to get out, otherwise
    # empty the station
    if np.all(signal[np.where(signal)[0]] > OUT_CONSTANT):
        for i in np.where(signal > 0)[0]:
            left[i] += OUT_CONSTANT
            signal[i] -= OUT_CONSTANT
    else:
        print(f'It {it}: Emptying stations')
        for i in np.where(np.logical_and(signal > 0, signal < OUT_CONSTANT))[0]:
            print(f'\t{signal[i]} unboarded {stations[i]}')
            left[i] += signal[i]
            signal[i] -= signal[i]
        for i in np.where(signal > 0)[0]:
            left[i] += OUT_CONSTANT
            signal[i] -= OUT_CONSTANT

    current_station = np.where(signal > 0)[0]
    nodelist = [list(G)[i] for i in current_station]
    nodelist2 = [list(G)[i] for i in np.where(left)[0]]

    normalized_signal = signal / INIT_VALUE
    colors = cmap(normalized_signal[signal > 0])

    normalized_left = left / (OUT_CONSTANT * 10)
    colors2 = cmap(normalized_left[left > 0])

    # Update visited stations list
    for i in np.where(signal)[0]:
        visited_stations.append(i)

    fig, ax = plt.subplots(figsize=(10, 7))

    nx.draw_networkx_edges(G, pos, node_size=20, ax=ax)
    im = nx.draw_networkx_nodes(G, pos, node_color='gray', node_size=20, ax=ax)

    im = nx.draw_networkx_nodes(G, pos, node_color=colors2, nodelist=nodelist2, node_size=20, ax=ax)

    im = nx.draw_networkx_nodes(G, pos, node_color=colors, nodelist=nodelist, node_size=20, ax=ax, node_shape='o',
                                edgecolors='red')

    cbar = plt.colorbar(im, ax=ax, label='Number of people', ticks=[0, 0.5, 1])
    cbar.set_ticklabels([0, (OUT_CONSTANT * 10) / 2, (OUT_CONSTANT * 10)])

    plt.savefig(f'metro_simulation2/{it}.png')
    plt.close()
    # fig.clf()

    if (np.sum(signal) == 0) or (np.sum(left) == INIT_VALUE):
        print(f'It {it}: Finished...')
        break
It 15: Emptying terminal stations
        780 unboarded Cerrillos
It 16: Emptying encountered stations
        802 unboarded Carlos Valdovinos
It 17: Emptying terminal stations
        381 unboarded Fernando Castillo Velasco
It 18: Emptying encountered stations
        371 unboarded Chile España
        70 unboarded Villa Frei
It 19: Emptying terminal stations
        522 unboarded Plaza de Puente Alto
It 20: Emptying encountered stations
        27 unboarded Manuel Montt
        88 unboarded Universidad Católica
        7 unboarded Santa Lucía
        361 unboarded Cristóbal Colón
It 20: Emptying stations
It 21: Emptying stations
        3 unboarded Cementerios
        3 unboarded Conchalí
It 24: Emptying stations
It 25: Emptying encountered stations
        173 unboarded Neptuno
It 25: Finished...
Total running time of the script: (0 minutes 2.982 seconds)
Estimated memory usage: 184 MB